
I first notice it when the soothing warmth of Summer transitions to the crisp cool of Fall. Suddenly, there's a subtle edge to the atmosphere. Leaves start dying on their branches. I believe that's where the smell originates: nature taking a sharp turn toward it's perennial period of decay. Yet, when I inhale and exhale that cool air, I feel more alive than I have for many warm, sluggish months. Nature's clock is winding down. Winter is coming. Anything you want to accomplish this year, it's now or never. It's do or die. There is a harmonic amplification between these vibrations and those of playoff baseball - one intensifies the other, and vice versa.
Baseball players returned to work over half a year ago at this point. Over the many summer months, the season has less of a smell and more of a hum. Day in, day out, the games tick by. There are certainly exciting moments during the season, but it's difficult to pinpoint when those moments occurred. The regular season is a marathon. Every step on that marathon technically matters, but you're more likely to remember the rhythm than the individual footfalls.
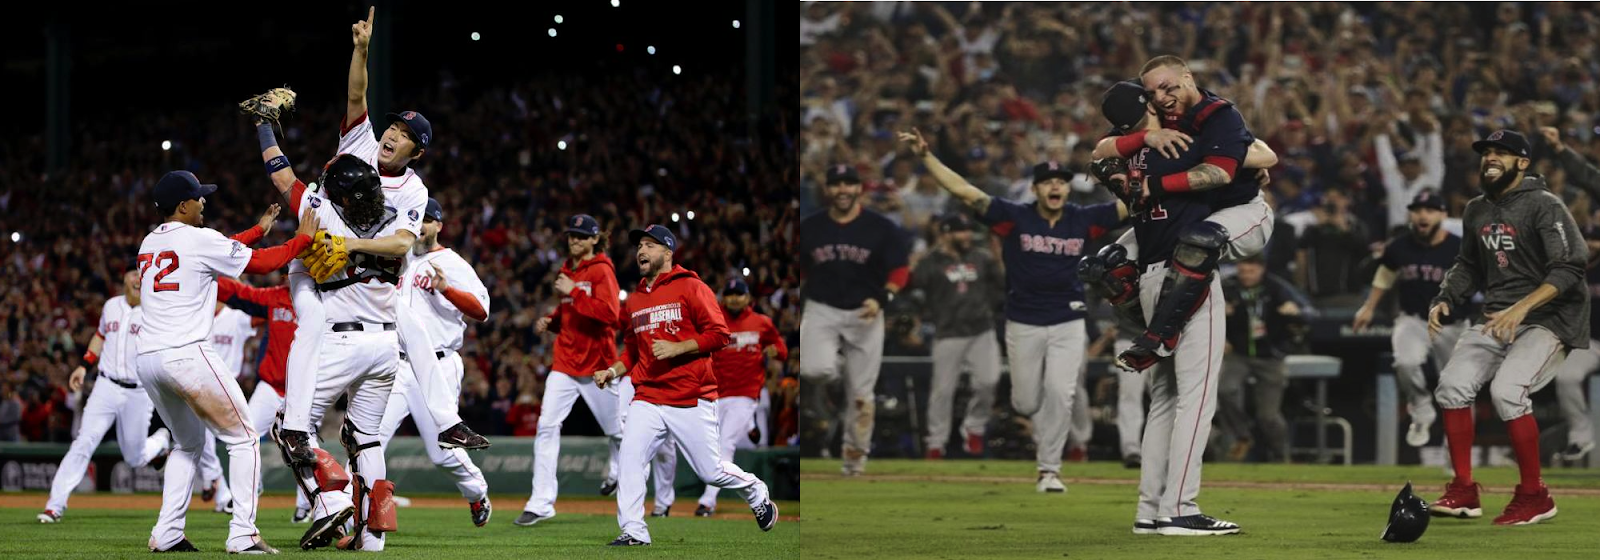
That all changes in October. Suddenly every pitch, swing, hit, and decision is scrutinized and memorable. As a Red Sox fan, what a memorable month it was, culminating in the team's 9th overall championship and the 4th of the 21st century. This team became the winningest in franchise history (108), eclipsing the team's previous record of 105 wins set in 1912 by a squad led by Tris Speaker and Smoky Joe Wood. More importantly, they are world champions.

How did this team succeed to such a remarkable degree in today's game, which has evolved so drastically since a century ago? Let's take a look at some of the biggest trends in baseball, and then put a spotlight on the players that comprised this latest championship team for Boston.
MLB in 2018
One of the biggest trends over the past several years has been batters putting an increased emphasis on launch angle - specifically, increasing the probability of hitting fly balls. The more fly balls you hit, the more likely you are to hit home runs and generate offensive production.
The data supports this assertion. In 2018, fly balls generated an OPS of .916 and a wRC+ or 133 (where 100 is league-average, so fly balls are 33% more productive). In contrast, grounders produce an OPS of just .494 and a wRC+ of 30. Line drives are obviously the ideal, but hitting liners is hard, so if you're going to err on either side, err on the side of hitting fly balls.
So what are hitters doing? They're adjusting their swings to be more of an uppercut. Here's a great example using Francisco Lindor of the Cleveland Indians. In 2016, 50% of his batted balls were grounders, and his launch angle chart looked like this (courtesy of Baseball Savant):

The size of the area displays how many balls were hit at that launch angle, while the red displays which batted ball angles resulted in hits. You can see how most of the hits are above the zero line. Now, let's take a look at his 2018 chart:

That's a lot fewer batted balls below the zero line, and he did indeed reduce his ground ball rate to 40%. What was the result?
- 2016 (684 PA): 15 HR, .301 BA, .358 OBP, .435 SLG, .794 OPS, .129 K/PA
- 2018 (745 PA): 38 HR, .277 BA, .352 OBP, .519 SLG, .871 OPS, .144 K/PA
This is one of the best-case scenarios for changing launch angle, but there are some unintended consequences with this shift. For starters, having more of an uppercut swing makes it more difficult to make consistent contact. You can see this in Lindor's stats as he is striking out a bit more now (14.4%) than before (12.9%). While the fly ball revolution isn't the only reason, it is one of the contributing factors for why strikeouts have gone up over time. Way up.

As you gaze upon the glorious chart I made in Excel, you're probably noticing a distinct increase over time. Strikeout percentage reached a new record high this year, as it did the year before that, and the year before that. Like I mentioned earlier, launch angle is NOT the only reason - max-effort pitching and the rise of bullpen usage play a major role here - but it is a contributing reason.
If you're the hitting coach for a team, do you care? Probably not. If your players are able to increase their OPS like Lindor did, then it is absolutely worthwhile.
A second consequence of the fly ball revolution is a decrease in batting average. This is heavily related to strikeouts, but it's worth noting just how far batting average has fallen:

For the record, .248 isn't an all-time low - hitting has come a long way since the Dead Ball Era. Still, you can see a 20-point decline in just a dozen years.
So what does all this mean? And how do the champion Boston Red Sox fit into all of this?
Offensive Chops
Let's focus first on the offense. The Red Sox, no doubt, have one of the best, scoring more runs (876) than any other team in MLB this year. What made it so successful?
Part of the reason is that the Red Sox were able to zig while other teams zagged. Not that they didn't take part in the fly ball revolution - Betts in particular has a MVP claim after making his own launch angle adjustments - but the Sox brought differentiating ability to the plate. Here's what I mean:
| Boston | MLB Team Average | |
Batting Average
| .268 (Rank: 1) |
.248
|
| Singles | 915 (Rank: 6) | 877 |
| Doubles | 355 (Rank: 1) | 276 |
| Home Runs | 208 (Rank: 9) | 186 |
| On-Base Percentage | .339 (Rank: 1) | .318 |
| Slugging Percentage | .453 (Rank: 1) | .409 |
| Stolen Bases | 125 (Rank: 3) | 82 |
| Strikeout % | 19.9% (Rank: 3) | 22.3% |
| Groundball % | 43.5% (Rank: 15) | 43.2% |
| Fly Ball % | 36.1% (Rank: 13) | 35.4% |
| Contact % | 79.3% (Rank: 3) | 76.9% |
| Soft Contact % | 16.5% (Rank: 2) | 18.1% |
There's a lot to unpack here, but let's start with the massive disparity in batting average (20 points). This is also the difference between Boston being an average OBP team versus the best OBP team. The second-highest team in BA is Cleveland at only .259.
The components of batting average deal with a player's ability to make frequent, good contact. The Red Sox as a team don't strikeout as often, make contact more often, and avoid soft contact better than almost any team. While the importance of fly balls is growing, the Red Sox aren't specialists in that regard like other teams, including some of the best in the bigs: Oakland (1st), the Dodgers (2nd), the Yankees (4th), and Astros (6th). If the fly ball is king, why did the Red Sox score more runs than these teams?
Ever since the debut of Moneyball, teams and fans were taught that walks and OBP were golden, but this data suggests that there should be some sympathy for the old standard: batting average. The Red Sox's ability to generate base hits is what differentiates them from the rest of the league offensively.
Here's why base hits are so important: there are a wider variety of outcomes with base hits versus walks. With a walk, there's one outcome, but with hits there are so many more: runners can move multiple bases, there can be errors that allow runners to advance, and of course there can be extra-base hits. All of these increase the likelihood of runners scoring.
Players today are trending toward "three true outcomes" (walks, home runs, or strikeouts), and some teams are living and dying by the long ball because of that. The Red Sox are instead getting a wider variety of offensive outcomes, such as singles and doubles, and when a team strings together a wider variety of outcomes, the result is scoring more runs - and a greater likelihood of scoring them in bunches.
I can't exactly quantify the number of times this team has batted around in a single inning, but it seems like this team was able to pour on runs at any time throughout the season. Remember Game 4 of the World Series? 9 runs in 3 innings. Or ALDS Game 3 (16 runs), or ALCS Game 3 (5 runs in the 8th) - it was just like that during the regular season.
| Let's not forget that Brock Holt hit for the first postseason cycle. |
Flashing the Glove
Defensive metrics have had a rise in popularity in recent years, though how they are formulated is difficult for the average fan to decipher. Fielding percentage is simple and empirical, but it is limited and doesn't account for a player's range and arm strength. Over time, Statcast has made some of these advanced defensive stats more approachable and understandable.

Overall, I lean towards use of Defensive WAR (wins above replacement). Here's how the Red Sox stack up:
- Catcher
- Sandy Leon: 5.9 (Rank: 17)
- Christian Vazquez: 4.1 (Rank: 38)
- First Base
- Mitch Moreland: -5.1 (Rank: 22)
- Steve Pearce: -6.3 (Rank: 27)
- Second Base
- Ian Kinsler: 11.6 (Rank: 3)
- Brock Holt: 2.3 (Rank: 21)
- Third Base - Rafael Devers: -3.0 (Rank 41)
- Shortstop - Xander Bogaerts: 7.2 (Rank: 6)
- Left Field - Andrew Benintendi: -1.5 (Rank: 17)
- Center Field - Jackie Bradley, Jr.: 10.1 (Rank: 5)
- Right Field - Mookie Betts: 11.6 (Rank: 1)
Kinsler was a solid pickup from a defensive perspective. I know fans will never forget his stumble in Game 3, but that one moment shouldn't define his overall body of work.
For me, the outfield is what impresses the most. Not satisfied with being standouts at the plate, they bring a lot of defense to the table. Technically, Benintendi is the worst of the three, but I don't believe the defensive stats fully account for how difficult it is to play LF under the Green Monster. Let's not forget that he's the guy who did this in the ALCS, and this in the World Series. Long live Air Benny!
/cdn.vox-cdn.com/uploads/chorus_image/image/61912167/AIRBennyCatch_AndrewBenintendi_MLBPA_BreakingT.0.jpg)
For more on the Red Sox's claim to having an all-time best outfield, check out this article by Fangraphs super-scribe Jeff Sullivan.
Armed and Dangerous
Headlined by ace Chris Sale, the Red Sox had one of the most effective starting rotations in the league - and it could have been even better from a statistical standpoint if Sale hadn't been limited over the last couple months of the season. Here's how the entire staff (bullpen included) ranked:
- K/9: 9.61 (Rank: 3)
- BB/9: 3.16 (Rank: 14)
- Ground ball %: 42.4 (Rank: 22)
- Left on base %: 75.8% (Rank: 5)
- ERA: 3.76 (Rank: 8)
- ERA- (park-adjusted ERA): 84 (Rank: 2)
- WAR: 20.6 (Rank: 4)
Ideally, the Red Sox would have performed a bit better in terms of limiting walks and inducing more ground balls, but the good news is that the Red Sox were one of the best teams in the league at leaving opposing runners on base. Striking out lots of batters helps with that, but it also speaks to having a solid defense that makes plays.
Overall, the staff had the 8th best ERA in the league, but I made an important find: they rank 2nd overall in ERA-, which adjusts ERA for park factor. Fenway Park is one of the friendlier stadiums in baseball for hitters, meaning that when you take the park advantage for hitters out of the equation, the Red Sox's ERA moves up the ranks quite a bit. Only the Astros had a better ERA-.

Though he only made 27 starts this year, there's a strong case to be made that Chris Sale should win the Cy Young Award for the AL. His 6.5 WAR trails only Justin Verlander's (6.8) by a smidge, but Verlander had 7 more starts and 56 more IP. A player's value comes from being active and performing, so I don't want to discount those IP, but what Chris Sale did with his IP versus Verlander's is much more impressive.
- ERA: 2.11 versus 2.52 for Verlander
- K/9: 13.50 versus 12.20
- GB %: 44.2% versus 29.1%
- WAR/9: 0.370 versus 0.286
At the end of the day, all three are worthy for votes, but mine would be for Sale based on the numbers and how he led the Red Sox staff to such strong pitching numbers.
Effective Leadership
While I always give the lion's share of the glory to the players, I would be remiss if I didn't mention the steady hand of rookie manager Alex Cora. Though he was new to the job, it never felt like he was out of his depth. Cora cultivated loyalty from his players early on, including a humanitarian trip to his home of Puerto Rico after it was hit by Hurricane Maria. Veterans Chris Sale and Rick Porcello joined him on the trip, having not even played a game for him yet, and it was clear all season long that the players were very much in favor of Cora's leadership. For more on Cora's first year as skipper of the Red Sox, I'd recommend reading this article by Jeff Passan at Yahoo.
Cora seemed to pull the right strings all year long, and the moment wasn't too big for him in the playoffs. He was aggressive with how he deployed his pitchers, pinch hitters, and defensive replacements, and one of the most underrated aspects of the team's preparation was coordinating their defensive alignments against opposing hitter tendencies. It became "predictably surprising" to me how often our players were right on the right spot for a hard liner.

Cora's willingness to embrace analytics to complement the soft skills of managing a dugout ultimately helped produce the winningest season in Red Sox history. My hope is that he sticks around long enough to one day eclipse Joe Cronin for the most wins by a manager in team history. For more about Alex Cora's impact on the Red Sox, check out this article by Alex Speier of the Boston Globe.
Best of Boston
This is now the 4th World Series title in 15 years for Boston. Every championship is memorable, but I couldn't help but go through the mental exercise of ranking the 4 teams against each other. Which one was the best of the bunch?
While I had some pretty firm opinions on this question already, I did consult Fangraphs for stats on each team. This is what I found:
- 2018: 50.2 Total WAR (29.6 for position players, 20.6 for pitchers)
- 2013: 51.8 Total WAR (35.8 for position players, 16.0 for pitchers)
- 2007: 48.1 Total WAR (29.7 for position players, 18.4 for pitchers)
- 2004: 45.3 Total WAR (24.7 for position players, 20.6 for pitchers)
Then I saw the defensive WAR metrics:
- 2018: 8.1
- 2013: 9.8
- 2007: 11.8
- 2004: -66.6
When I reminisce about the 2004 team, I always think of the insane offense and the elite pitching, but I admit that I rarely give a thought to the defense. Manny's meanderings in left field have largely been blocked from my memory, as is Johnny Damon's noodle arm and Kevin Millar's lack of range. Even Bill Mueller and Trot Nixon had negative defensive WAR that year. It makes you reflect in awe at just how good the pitching and offense had to be to overcome those massive deficiencies.
The 2004 band of idiots will always hold a special place in my heart, but I have to take them out of contention for this exercise. Same for 2007, which doesn't stand out enough based on the metrics or in my memory. That leaves us with 2013's "Get Beard" versus 2018's "Do Damage."
Because this is "important," I'm going to be thorough and go position-by-position here. The player listed represents the typical starter, and their WAR represents just their time with the Red Sox (in case of mid-season acquisitions):
| 2013 | 2018 | |
Catcher
| Jarrod Saltalamacchia WAR: 3.5 |
Sandy Leon
WAR: -0.9 |
| First Base | Mike Napoli WAR: 3.4 | Mitch Moreland WAR: 0.6 |
| Second Base | Dustin Pedroia WAR: 4.8 | Ian Kinsler WAR: 0.0 |
| Third Base | Will Middlebrooks WAR: 0.5 | Rafael Devers WAR: 1.0 |
| Shortstop | Stephen Drew WAR: 3.6 | Xander Bogaerts WAR: 4.9 |
| Left Field | Daniel Nava WAR: 2.7 | Andrew Benintendi WAR: 4.3 |
| Center Field | Jacoby Ellsbury WAR: 4.6 | Jackie Bradley Jr. WAR: 2.8 |
| Right Field | Shane Victorino WAR: 4.7 | Mookie Betts WAR: 10.4 |
| Designated Hitter | David Ortiz WAR: 3.4 | J.D. Martinez WAR: 5.9 |
| 4th Outfielder | Jonny Gomes WAR: 1.5 | Brock Holt WAR: 1.4 |
| Utility Infielder | Jose Iglesias WAR: 1.8 | Eduardo Nunez WAR: -0.4 |
| Bench Bat | Mike Carp WAR: 1.4 | Steve Pearce WAR: 1.2 |
| Starting Pitcher 1 | Jon Lester WAR: 3.5 | Chris Sale WAR: 6.5 |
| Starting Pitcher 2 | Clay Buchholz WAR: 2.8 | Rick Porcello WAR: 2.7 |
| Starting Pitcher 3 | John Lackey WAR: 2.4 | David Price WAR: 2.7 |
| Starting Pitcher 4 | Felix Doubront WAR: 2.2 | Eduardo Rodriguez WAR: 2.2 |
| Starting Pitcher 5 | Jake Peavy WAR: 1.0 | Nathan Eovaldi WAR: 1.5 |
| Reliever 1 | Koji Uehara WAR: 3.1 | Craig Kimbrel WAR: 1.5 |
| Reliever 2 | Junichi Tazawa WAR: 0.9 | Matt Barnes WAR: 1.3 |
| Reliever 3 | Craig Breslow WAR: 0.5 | Joe Kelly WAR: 0.7 |
| Reliever 4 | Andrew Miller WAR: 0.3 | Ryan Brasier WAR: 0.7 |
The first major difference I see is that the 2013 team got solidly positive WAR from more positions than the 2018 team. Aside from third base, each position is close to 3 WAR or more. It's tremendous to see positive contributions across a lineup like that. Meanwhile, all pitchers are positive on WAR, but not to an elite degree, aside from Uehara.
In contrast, the 2018 squad has several positions with weaker performance (C, 1B, 2B, 3B), but it has solid-to-elite production elsewhere. The biggest headliner is Mookie Betts, who put up an incredible MVP-caliber season with a .346 batting average, 129 runs, 32 home runs, 30 stolen bases, 80 RBI, and the highest defensive WAR ranking for right field to become the only player in MLB this year to produce WAR in the double digits (10.4). Not to be overshadowed, Xander, Benintendi, and J.D. all out-produced their 2013 counterparts.
Which lineup you choose is a matter of personal philosophy. Do you want the team that's stacked with good players, or do you want the team with a handful of great players?
As for the pitching, I do believe the 2018 team has the edge. Chris Sale clearly beats Lester as the ace of the rotation, and Eovaldi put up a very solid 1.5 WAR in only part of a season with Boston (and was critical in the postseason).
In the 'pen, we've got one of the all-time best seasons from a reliever in Koji Uehara (previously chronicled by TDZ) beating out Kimbrel, but the reliever depth in 2018 is actually a bit better, with Barnes, Kelly, and Brasier all out-performing their counterparts. This almost makes up for Koji's dominance, but not quite.
Now for the moment of truth, when I have to choose one child over the other...
Ultimately, despite the overall WAR numbers, I'm going with the 2018 Red Sox. There's something to be said for a team that won more than any other in Red Sox history, trampled two 100-win teams in the AL playoffs, and dominated the best the NL could muster.
One could argue that if the 2013 team had Alex Cora at the helm, instead of John Farrell, it could have performed even better, but that would be conjecture. Give me the 2018 rotation and the solid bats (and gloves) of the 2018 nucleus, and I'll play the match-ups with the rest of the lineup and be confident to win any series.
Thanks for reading, and enjoy the off-season and hot stove this winter!
No comments:
Post a Comment